Debt Service Ratio
- Cesar Tonnoir (Unlicensed)
Analytics
Debt Service Ratio
Overview
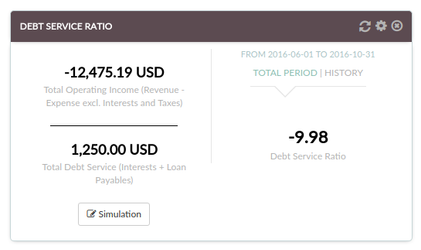
This widget represents the calculation of the of your total operating income over your total debt. You should target a value above 1.0, which means that you have more income that what you have to pay in debt.
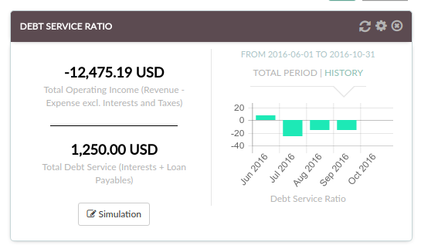
This ratio can be displayed either on a "result for total period" mode or on a "history mode". In "history mode", a bar chart will be displayed, showing the ratio's results over the selected period of time.
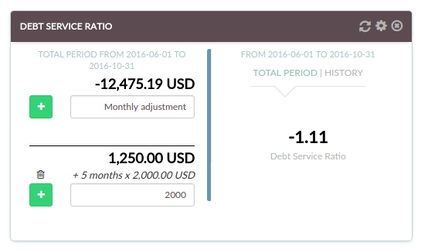
A simulation mode is also available, allowing you to adjust the calculation for each interval. For example, let's take the hypothesis that your business will behave about the same way in terms of revenue for the next 6 months than it has been for the past 6 months. If you want to determine whether your business will be able to support the cost of a new loan ($2,000 per month for the example), you can:
- click the "simulation" button on the front of the widget
- add "2000" in the text field under the "Debt service" figure
The amount of $2,000 will be added to the representation of your debt, and taken into account for the calculation of the ratio at each interval of the selected period.
Calculation
For each interval,
RATIO = sum_of_balances(ALL REVENUE ACCOUNTS OF TYPE 'INCOME')
/
sum_of_balances(ONLY EXPENSE ACCOUNTS OF TYPES 'INTEREST PAID' and 'TAXES PAID')
Settings
- The time period can be modified by accessing the settings panel (cogwheel on the top-right)
- The display can be changed by clicking the "Balance" or "History" links on the front of the widget
- The simulation mode can be used by clicking the corresponding button on the front of the widget
See it in Xero
This ratio is not directly displayable in Xero. However, you can easily display your total assets and total liabilities by displaying the PnL report (see Profit and Loss).
Make sure you select the same time period in the Xero report than on the widget.
- "Income" on the widget corresponds to the value for "Net profit" minus the value for "Non-operating Income" in the Xero report.
- "Debt Service" corresponds to the sum of the values for all your "Interest paid" or "taxes paid" accounts.
Noticeable differences with the Impac! widget
Calculation has to be done by hand, for each interval.

See it in QuickBooks
This ratio is not directly displayable in QuickBooks. However, you can easily display your total assets and total liabilities by displaying the PnL report (see Profit and Loss).
Make sure you select the same time period in the QuickBooks report than on the widget.
- "Income" on the widget corresponds to the value for "Total Income" in the QuickBooks report.
- "Debt Service" corresponds to the sum of the values for all your "Interest paid" or "taxes paid" accounts.
Noticeable differences with the Impac! widget
Calculation has to be done by hand, for each interval.

See it in MYOB
This ratio is not directly displayable in MYOB. However, you can easily display your total assets and total liabilities by displaying the PnL report (see Profit and Loss).
Make sure you select the same time period in the MYOB report than on the widget.
- "Income" on the widget corresponds to the value for "Total Income" in the MYOB report.
- "Debt Service" corresponds to the sum of the values for all your "Interest paid" or "taxes paid" accounts.
Noticeable differences with the Impac! widget
Calculation has to be done by hand, for each interval.

Any question? Contact us on support@maestrano.com