Expenses / Revenue
Expenses / Revenue
Overview
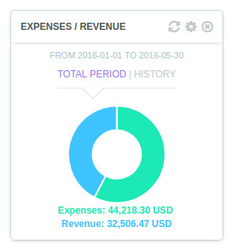
This widget shows a comparison of your total expenses and total income over a given period of time.
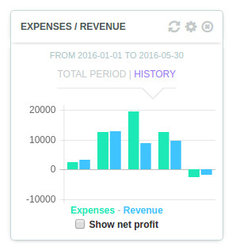
The Total period mode shows a pie chart with the sums of all your expenses and all your income over the full selected period. The History mode shows a line chart with your historical expenses and income over the selected period.
Calculation
All accounts of classifications "EXPENSE" and "REVENUE" which had transactions attached to them during the selected period are going to be taken into account. The figures are obtained by adding up all the transactions related to these accounts.
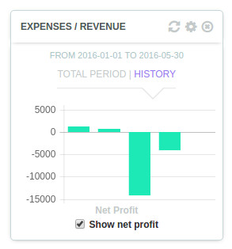
The Net profit is obtained by subtracting the total revenue by the total expenses.
Settings
The time period can be modified in the settings section (top-right cogwheel).
In "history" mode, the net profit can be displayed instead of a comparison between expenses and revenue, simply by ticking the corresponding check-box.
Verify it in Impac! (Profit and Loss widget)
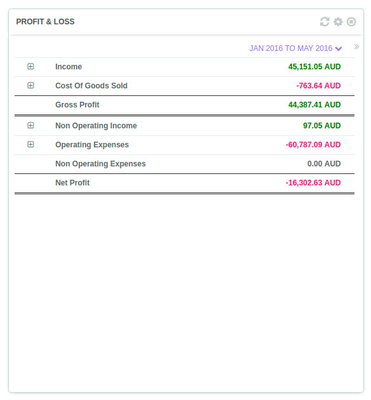
In Impac!, the Profit and Loss widget can be used to verify what exactly stands behind the figures displayed on the Expenses / Revenue widget.
- The Total Revenue in Expenses / Revenue can be found by adding up the Income and the Non Operating Income lines in the Profit and Loss widget.
- The Total Expenses in Expenses / Revenue can be found by adding up the Cost of Goods Sold, the Operating Expenses, and the Non Operating Expenses lines in the Profit and Loss widget.
Make sure the same time period is selected for both the two widgets.
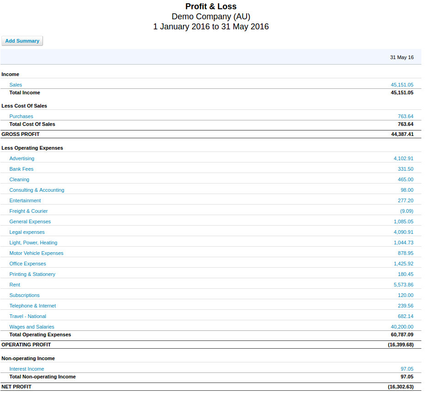
See it in Xero
The Xero Profit and Loss report can be used: Menu > Reports > All Reports > Profit and Loss.
Exactly as per Impac! Profit and Loss widget:
- The Total Revenue in Expenses / Revenue can be found by adding up the Income and the Non Operating Income lines in the report.
- The Total Expenses in Expenses / Revenue can be found by adding up the Cost of Goods Sold, the Operating Expenses, and the Non Operating Expenses lines in the report.
The time range in Xero must match the one selected in the widget:

Noticeable differences with the Impac! widget
Impac! widget shows an aggregate of all the expenses and revenue in a single chart. The report in Xero shows a breakdown by income/expense category and by account.
If a breakdown is needed, it can also be found in Impac! Profit and Loss widget.
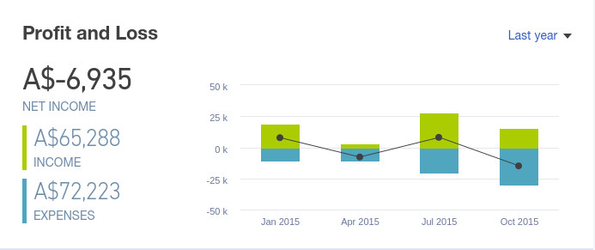
See it in QuickBooks
On QuickBooks' Dashboard, the Profit and Loss widget can be used.
Just make sure the time range selected (top-right drop-down list) matches the one you've selected in the Impac! widget.
Noticeable differences with the Impac! widget
In QuickBooks, the net income and expenses are displayed. In Impac!, the corresponding gross amounts are going to be displayed.
Any question? Contact us on support@maestrano.com